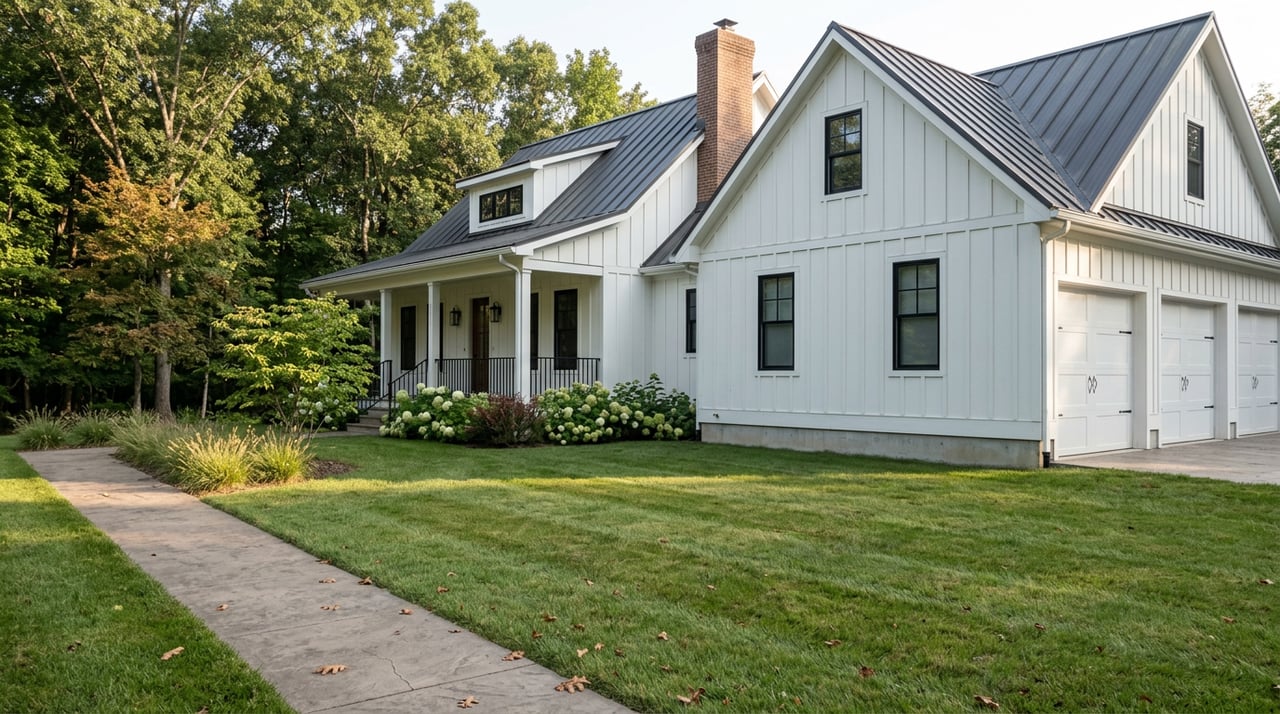
A homesite on Pond View Road, off Route 16 near I-495, has been for sale in one form or another since 2022. It first showed up in the MLS marketed as "to be built," priced at $1,849,900. It was still sitting there in late 2023, same price, same promise. Today it's under construction and nearly finished, a five-bedroom modern farmhouse colonial on 3.62 acres built by Four Season Homes. The asking price is now $2,375,000, and in its current listing it has logged 143 days on the market.
That single lot has never sold. And that's exactly why it matters if you're trying to make sense of what a home costs in Holliston right now.
Pull up two different sources this summer and you'll get two different Holliston housing markets. One says prices are climbing. The other says the typical home is selling for well under a million dollars. Both are correct. They're just measuring different things, and the gap between them is roughly the price of that one unsold lot.
Two Medians, One Town
As of August 2026, the median Holliston listing carried a price of $899,000, up 3 percent from a year earlier, spending a median of 43 days on the market before going under agreement. A snapshot taken in early June 2026 showed something similar: 23 active listings with a median list price of $875,000 and an average of 48 days on market.
Now look at what actually closed. Over the trailing twelve months, Holliston's median closed sale price was $728,000, up just 2 percent, with the typical home selling in 23 days.
That's a gap of roughly $150,000 to $200,000 between what's currently sitting on the market and what's actually changing hands.
| Active listings (2026 snapshots) | Closed sales (trailing 12 months) | |
|---|---|---|
| Median price | $875,000–$899,000 | $728,000 |
| Typical time to sell | 43–48 days | 23 days |
| What it measures | Homes still waiting for a buyer | Homes that found one |
Neither number is wrong. A listing median tells you what sellers are asking for the inventory currently on the market. A sold median tells you what buyers actually paid, averaged across everything that closed. In most towns those two numbers stay close enough that the difference doesn't matter. In Holliston, right now, it does.
Why One Listing Can Move a Town's Median
Holliston typically has somewhere between 20 and 30 homes on the market at any given moment. That's a small enough pool that a handful of outliers can swing the median in a way they never would in Natick or Framingham.
The Pond View lot isn't sitting alone at the top of the range. Nearby, 14 Fiske Pond Road, a five-bedroom, 5,740-square-foot new build on 1.6 acres, is listed at $2,350,000 and has logged more than 150 days on the market. A third property, 39 Summit Pointe Drive, carries an asking price of $1,895,000. All three are new-construction or near-new luxury homes competing for a very narrow slice of buyers willing to spend north of $1.8 million in a town of roughly 13,500 people.
None of these three has sold yet. So none of them shows up in the trailing-twelve-month sold median of $728,000. But all three sit in the active pool, which is exactly why the listing median reads $150,000 to $200,000 higher than what's actually closing. In a pool of 20-something homes, three multimillion-dollar listings sitting for months at a time will pull the middle of the distribution up with them, even though the overwhelming majority of Holliston sales are colonials and capes trading well under a million dollars.
This isn't unique to one subdivision. It's what happens any time a small town's active inventory skews toward a handful of expensive spec homes that are taking longer than average to find a buyer. The listing side of the market and the closing side of the market start telling different stories, and a headline median doesn't tell you which one you're looking at.
The Regional Backdrop
This pattern isn't isolated to Holliston. A regional look at the Greater Boston market through early June 2026 found that MetroWest's sale-to-list ratio, the median close price divided by the original list price, cooled from 103.5 percent a year earlier to an even 100 percent. In plain terms, buyers across MetroWest are no longer routinely paying over asking the way they were a year ago. That same analysis flagged a related issue directly relevant here: days-on-market figures across the region can be inflated by developer-controlled or relisted inventory, properties that get pulled and reposted, resetting the clock on how "new" they appear even though they've effectively been for sale much longer.
Statewide, the picture is milder. The median listing price across Massachusetts was $749,450 in July 2026, according to Federal Reserve data drawn from Realtor.com's inventory tracking. Holliston's active-listing median sits well above that statewide figure, largely because its inventory mix right now leans toward larger, newer, and pricier homes relative to what's actually turning over.
What This Means If You're Comparing Towns
If you're shopping MetroWest and using online medians to size up Holliston against Wellesley, Needham, or Framingham, a few habits will keep you from anchoring on the wrong number:
- Ask whether a median you're looking at reflects active listings or closed sales. They answer different questions, and a portal rarely makes the distinction obvious.
- Ask how many transactions sit behind the number. A median built on 20 to 30 active listings moves a lot more per outlier than one built on hundreds of monthly closings in a larger market.
- Ask for a property's full listing history, not just its current days-on-market count. A home that's been relisted after sitting unsold can show a deceptively low number even though it's been effectively for sale for months or years.
- If you're specifically shopping the new-construction or custom-build tier, expect a slower, thinner market than the resale numbers suggest. The homes at the top of Holliston's price range are competing for a small buyer pool and often carry room to negotiate that a fast-moving resale colonial won't.
For a move-up buyer comparing a turnkey colonial against a spec-built new construction lot, the practical takeaway is that you're really shopping two different markets inside the same zip code, with two different timelines and two different levels of negotiating leverage.
FAQ
Does Holliston's rising list-price median mean typical homes cost more this year? Not necessarily. The listing median is being pulled upward by a small number of luxury spec homes still on the market. The trailing twelve-month closed-sale median, a better read on what typical buyers actually paid, rose only 2 percent.
How do I check whether a listing's "days on market" reflects its full history? Ask your agent to pull the complete MLS history for the address, including any prior listings under different MLS numbers. A relisted property can show a low current days-on-market figure while having been effectively for sale for years, as with the Pond View lot.
Is the $1.8 million-plus new-construction tier a different negotiation than a typical resale home? Generally yes. With only a handful of buyers shopping that price band at any given time, sellers in that tier often have less pricing leverage than the headline numbers suggest, even in a town where the broader resale market moves quickly.
If you're weighing a move-up resale against a custom or spec-built new construction option in Holliston, or trying to figure out what a specific listing's price and time on market are actually telling you, Barber Real Estate can walk through the property's full history and what it means for your offer. Schedule a free consultation and we'll help you read the numbers before you write one.